# A tibble: 2 × 3
  Gender mean_purchase median_purchase
  <chr>          <dbl>           <dbl>
1 Female          60.2              60
2 Male 59.5 60Shoppers
Shoppers
Huge thanks to Sourrav Banerjee who compiled and published the data I used for this analysis.
For a consumer, finding out other peoples shopping trends might not be that useful. For small businesses however, knowing how frequent a product is being sold and by which demographic could be important. Realistically I can’t definitively say what products will maximize their sales, but I could determine how likely certain products get bought. This would give a solid baseline as to which product type should be continued.
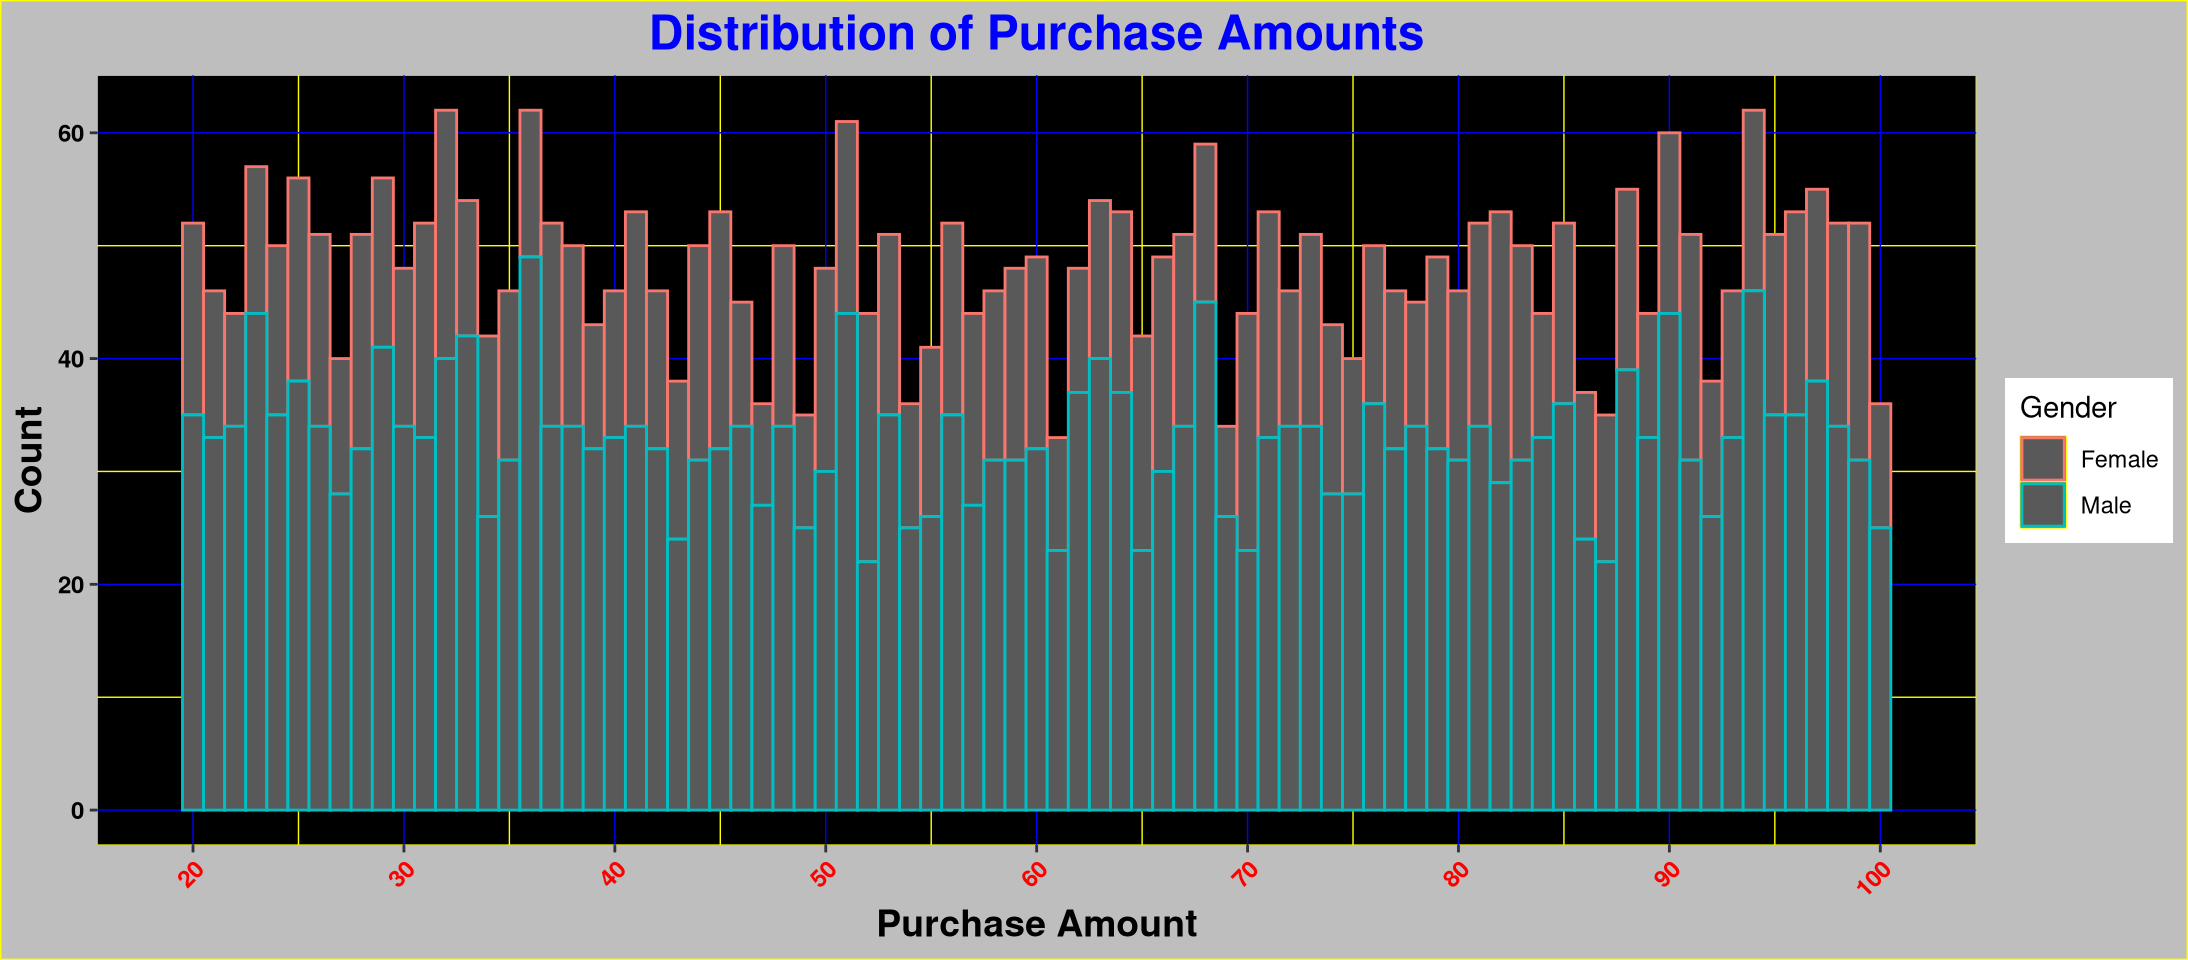
Lets begin by getting a rough view of a part of the data we’re going to be graphing. Separated by gender (male and female) we’ll see how the data is distributed with the amount of purchases they’ve done. This is to see if there’s any large bias in the data set I might need to consider later.
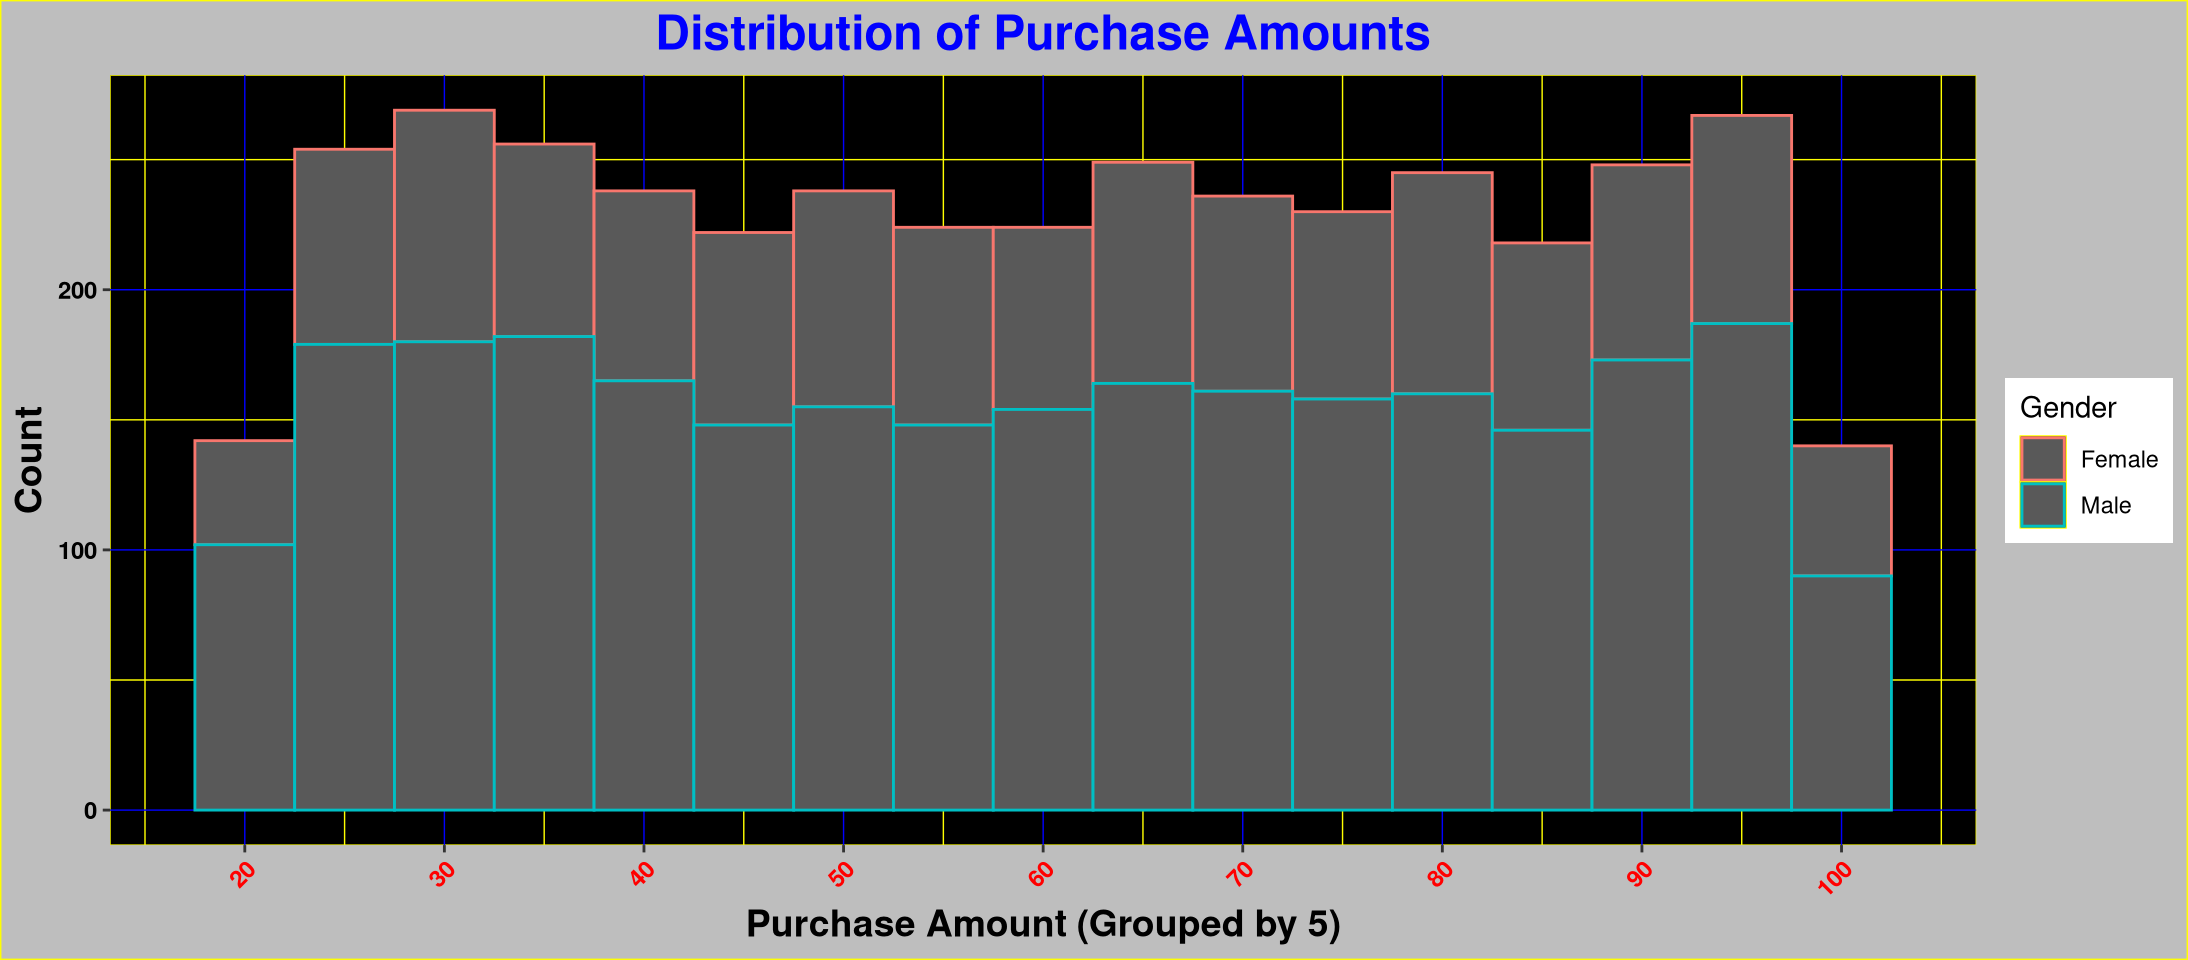
With this I could say the spending habits of men and women displayed in the data are pretty evenly distributed. Now lets get a basic graphs to help visualize some of the differences between how many more instances of people purchasing 20-100 items exist. The count value in the second graph is significantly larger because, for clarity, I grouped up the amount purchased in frequencies of five (20-24, 25-29, so on so forth). That is to say all people who only bought twenty to twenty four items are grouped together.
Bar graphs are good quick visualizations but having the data more accurately displayed is important. Suppose you wanted to see what payment method your clients had and what data you had to work with.
# A tibble: 6 × 2
  `Payment Method` count
  <chr>            <int>
1 Bank Transfer      612
2 Cash               670
3 Credit Card        671
4 Debit Card         636
5 PayPal             677
6 Venmo              634
, , = Female
Accessories Clothing Footwear Outerwear
Bank Transfer 62 92 30 19
Cash 66 93 38 15
Credit Card 73 99 32 19
Debit Card 50 92 28 11
PayPal 74 90 41 16
Venmo 67 90 30 21
, , = Male
Accessories Clothing Footwear Outerwear
Bank Transfer 118 193 62 36
Cash 148 208 66 36
Credit Card 145 207 61 35
Debit Card 145 201 71 38
PayPal 158 192 62 44
Venmo 134 180 78 34This is still pretty general though, let’s look at something much more specific. These next expanded tables with regards to men and women detail the frequency purchase for specific items and their quantity.
, ,  = Female


             Annually Bi-Weekly Every 3 Months Fortnightly Monthly Quarterly
  Backpack          5         5              8           5       1         6
  Belt              7         7              8           5      13         8
  Blouse           13        14             14           3       7         7
  Boots             6         9              3          10       2        12
  Coat              9         5              5           9       7         5
  Dress            10        10              9           2      10         4
  Gloves            9         6              2           6       3         5
  Handbag           4        11             10           7      12         7
  Hat               9         7              7           6       8         8
  Hoodie            4         6             10           8       9         8
  Jacket            9         6             10          13       9         4
  Jeans             2         3              6           5       9         2
  Jewelry          10         7             13           8       3         6
  Pants             7         8              3           5      10         9
  Sandals           9        11             10           7       9         5
  Scarf            11         5              5           3       7         7
  Shirt             7        12              8           9      10         7
  Shoes             6         5              7           4       7         7
  Shorts            5         8              5           7       6         8
  Skirt             4         6              9           7      10         5
  Sneakers          5         3              7           8       5         8
  Socks            13         8              8           7       7         7
  Sunglasses        6         9              4           9       9        12
  Sweater           5        13              7           4       4         8
  T-shirt          10         4              8           6       8         4

             Weekly
  Backpack        7
  Belt            7
  Blouse          8
  Boots           8
  Coat            7
  Dress           7
  Gloves          6
  Handbag         7
  Hat             7
  Hoodie          6
  Jacket          3
  Jeans           2
  Jewelry         5
  Pants           6
  Sandals         8
  Scarf           7
  Shirt           6
  Shoes          12
  Shorts          9
  Skirt           8
  Sneakers        6
  Socks           8
  Sunglasses      7
  Sweater         9
  T-shirt         6

, ,  = Male


             Annually Bi-Weekly Every 3 Months Fortnightly Monthly Quarterly
  Backpack         17        16             15          17      10        15
  Belt             17        17             19          14      10        14
  Blouse           19        17             17          17       8        18
  Boots             9        14             16          15       6        19
  Coat             14        15             13          18      13        22
  Dress            21        10             19          18      17        13
  Gloves           13        17             14          15      17        14
  Handbag          17         9             21          14      14        12
  Hat              12        10             13          13      21        21
  Hoodie           11        21             13          11      16        14
  Jacket           11        14             19          13      15        21
  Jeans            18         6             12          11      19        17
  Jewelry          16        25             12          13      17        17
  Pants            14        11             22          15      22        19
  Sandals          17        10             17          17      14        12
  Scarf            18        15             16          20      17        13
  Shirt            24        11             12          10      18        15
  Shoes            20        15             17          15      15        11
  Shorts           12        19             19          17      14        12
  Skirt            16        13             15          17      15        14
  Sneakers         15        13             15          20      17         9
  Socks            16        16             16          10      19        18
  Sunglasses       13        14             13          15       9        24
  Sweater          17        16             15          21      11        12
  T-shirt          10        15             18          13      14        18

             Weekly
  Backpack       16
  Belt           15
  Blouse          9
  Boots          15
  Coat           19
  Dress          16
  Gloves         13
  Handbag         8
  Hat            12
  Hoodie         14
  Jacket         16
  Jeans          12
  Jewelry        19
  Pants          20
  Sandals        14
  Scarf          13
  Shirt          20
  Shoes           9
  Shorts         16
  Skirt          19
  Sneakers       14
  Socks           6
  Sunglasses     17
  Sweater        22
  T-shirt        13
Perfect! With this we could infer what items would be in higher demand and how often the store should stock.